
Investors are often told that the stock market is volatile. This is one of its defining characteristics. It is however important to understand exactly what this means.
The volatility of the stock market comes out in two distinct ways. The first is that, in the short term, the market is almost entirely unpredictable. A recent analysis by Corion Capital shows that the chances of seeing a positive return from the JSE on any single day are only slightly better than a coin toss.
Over the past 10 years, the JSE has made daily gains 53% of the time. As the graphic below illustrates, the dispersion of negative and positive days is almost equal.
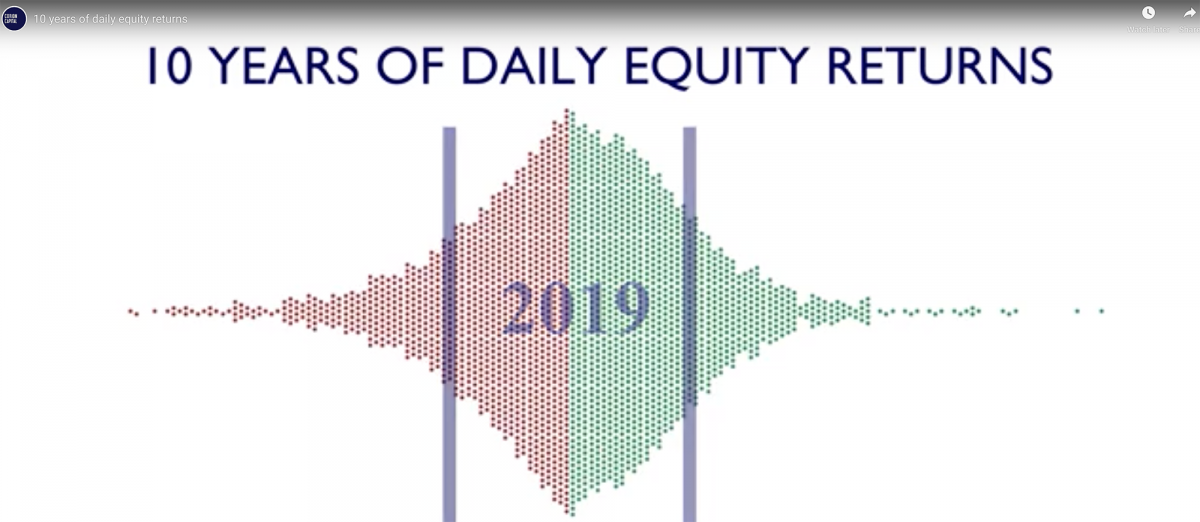
This is not just characteristic of the past decade. The most recent Long Term Perspectives analysis published by Old Mutual’s MacroSolutions boutique shows that over the 20 years to the end of 2018, the JSE delivered a negative daily return 45% of the time.
Extending the measurement period to a week doesn’t change this significantly. According to Long Term Perspectives, the JSE was lower 43% of the time on a weekly basis, which is still only slightly less than random. Even over a month, the JSE was down 38% of the time. Over the past 12 months, this has been 50%.
JSE monthly movements
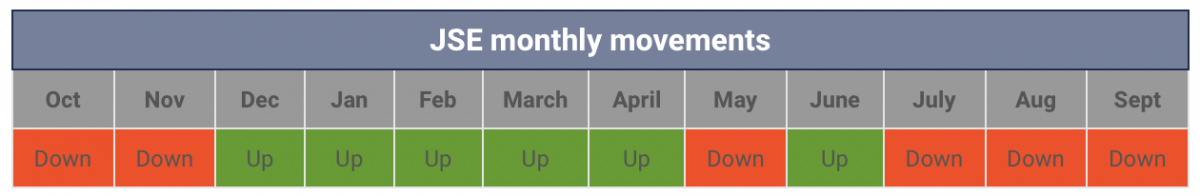
Source: Bloomberg
For six of these months the JSE was higher, and for six months it was lower. What makes this even more noteworthy is that over the full period, the market was effectively flat. It has vacillated significantly, but ended up at the same level.
What this shows is that the market is constantly in flux over the short term. No investor can have significant confidence in where the market might go tomorrow, next week or next month all of the time. Even the best technical analysts, who meticulously study market trends, are very often wrong.
This is why it is so important to see the stock market as a long term vehicle for building wealth. Day to day, week to week and even month to month it is unpredictable, but over many years, it is far less so. Long Term Perspectives shows that since 1960, there has not been a single five- or 10-year period over which the JSE has delivered a negative return. Despite being up for only 52% of the days in the past 10 years, the JSE has still gained 11.5% per annum over this period.
Big swings
The second manifestation of volatility is that the market can experience very large, very rapid changes. Corion Capital’s analysis shows that since 2008, the largest one-day gain on the market has been 4.4%, and the worst loss was -3.6%.
These are substantial deviations. What Corion Capital also found, however, was that these are highly infrequent.
In fact, 95% of the time, the JSE didn’t gain or lose more than 2% on any single day. For 75% of the time, the daily movements were lower than 1%.
Most of the time, therefore, the market is doing very little. Of course, 30 consecutive days of 1% gains or 1% losses would be highly meaningful, but this has never happened. As pointed out earlier, the market’s volatility inevitably means that there will be days of losses even in a strong upward market, and days of gains even when the market is strongly trending downwards.
Following the daily market movements is therefore meaningless. Not only are the significant majority of day-to-day changes too small to be consequential, they are also not indicative of what will happen next.
The important lesson for investors to appreciate when it comes to volatility is that the stock market often gives the impression that a lot is happening, when little actually is. Most of the time, movements in share prices only really become meaningful over long periods of time.
In that respect, equities are predictably unpredictable in the short term. Any investor looking at their portfolio every day should expect to be disappointed almost as often as they are pleased. Over the long term, however, the latter emotion is far more likely to win out.
Source: https://www.moneyweb.co.za/investing/every-day-on-the-jse-in-the-last-10-years-in-one-chart/?fbclid=IwAR3jjhS011R9xkzTSAXZK989sgw_qmINHElEsVDNdDgK4A3mArjO-Ly7V7U